Curve Fitting#
Teng-Jui Lin
Content adapted from UW CHEME 375, Chemical Engineering Computer Skills, in Spring 2021.
Python skills and numerical methods
curve fitting by
scipy.optimize.curve_fit()minimizing least squared residual by
scipy.optimize.minimize()
ChemE applications
Curve fitting of data
Clausius-Clapeyron equation
Fitting the Clausius-Clapeyron equation#
Problem Statement. Fit a curve according to the Clausius-Clapeyron equation for the temperature series
[80, 100, 120, 140, 160, 180, 200, 220, 240, 260, 280]
with units of K, and the vapor pressure series
[4.98e-02, 1.22e+01, 3.65e+02, 4.02e+03, 2.43e+04, 6.62e+04, 1.47e+05, 2.68e+05, 8.91e+05, 9.85e+05, 1.62e+06]
with units of Pa.
Solution. One form of the Clausius-Clapeyron equation is given by
where
Given
where
We can also write it in the exponential form:
Implementation: Curve fitting using scipy.optimize.curve_fit()#
In this approach, we use scipy.optimize.curve_fit() to fit the exponential form directly.
import numpy as np
import matplotlib.pyplot as plt
from scipy.optimize import curve_fit
from scipy.optimize import minimize
# define given data points
T = np.array([80, 100, 120, 140, 160, 180, 200, 220, 240, 260, 280])
Pv = np.array([4.98e-02, 1.22e+01, 3.65e+02, 4.02e+03, 2.43e+04, 6.62e+04, 1.47e+05, 2.68e+05, 8.91e+05, 9.85e+05, 1.62e+06])
def clausius_clapeyron(T, A, B):
    '''Exponential form of the Clausius-Clapeyron equation'''
    return np.exp(A/T + B)
# use scipy.optimize.curvefit()
popt, pcov = curve_fit(clausius_clapeyron, T, Pv)
popt
array([-1477.20170831, 19.57105488])
# define curve fit line
T_fit = np.arange(60, 300, 10)
Pv_fit = clausius_clapeyron(T_fit, *popt)
# plot settings
%config InlineBackend.figure_format = 'retina'
%matplotlib inline

plt.rcParams.update({
    'font.family': 'Arial',  # Times New Roman, Calibri
    'font.weight': 'normal',
    'mathtext.fontset': 'cm',
    'font.size': 18,

    'lines.linewidth': 2,

    'axes.linewidth': 2,
    'axes.spines.top': False,
    'axes.spines.right': False,
    'axes.titleweight': 'bold',
    'axes.titlesize': 18,
    'axes.labelweight': 'bold',

    'xtick.major.size': 8,
    'xtick.major.width': 2,
    'ytick.major.size': 8,
    'ytick.major.width': 2,

    'figure.dpi': 80,

    'legend.framealpha': 1,
    'legend.edgecolor': 'black',
    'legend.fancybox': False,
    'legend.fontsize': 14
})
fig, axs = plt.subplots(1, 2, figsize=(8, 4))
axs[0].plot(T, Pv, 'o', label='Data point')
axs[0].plot(T_fit, Pv_fit, label='Curve fit')
axs[0].set_xlabel('$T$')
axs[0].set_ylabel('$P^*$')
axs[0].set_xlim(60, 300)
axs[0].set_ylim(0, 2e6)
axs[0].ticklabel_format(axis="y", style="sci", scilimits=(0, 0))
axs[0].legend()

axs[1].plot(1/T, np.log(Pv), 'o', label='Data point')
axs[1].plot(1/T_fit, np.log(Pv_fit), label='Curve fit')
axs[1].set_xlabel('$\dfrac{1}{T}$')
axs[1].set_ylabel('$\ln P^*$')
axs[1].set_ylim(top=16)
axs[1].legend()


plt.tight_layout(True)

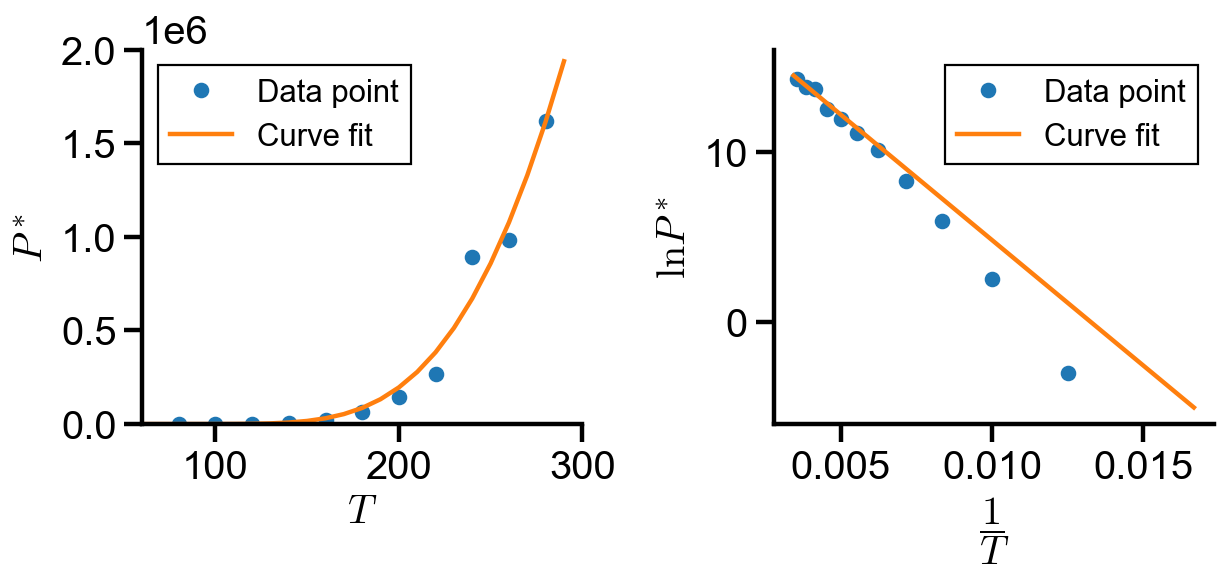
By inspection of the linear form, the curve fit did not best fit the trend as
Implementation: Curve fitting using scipy.optimize.curve_fit()#
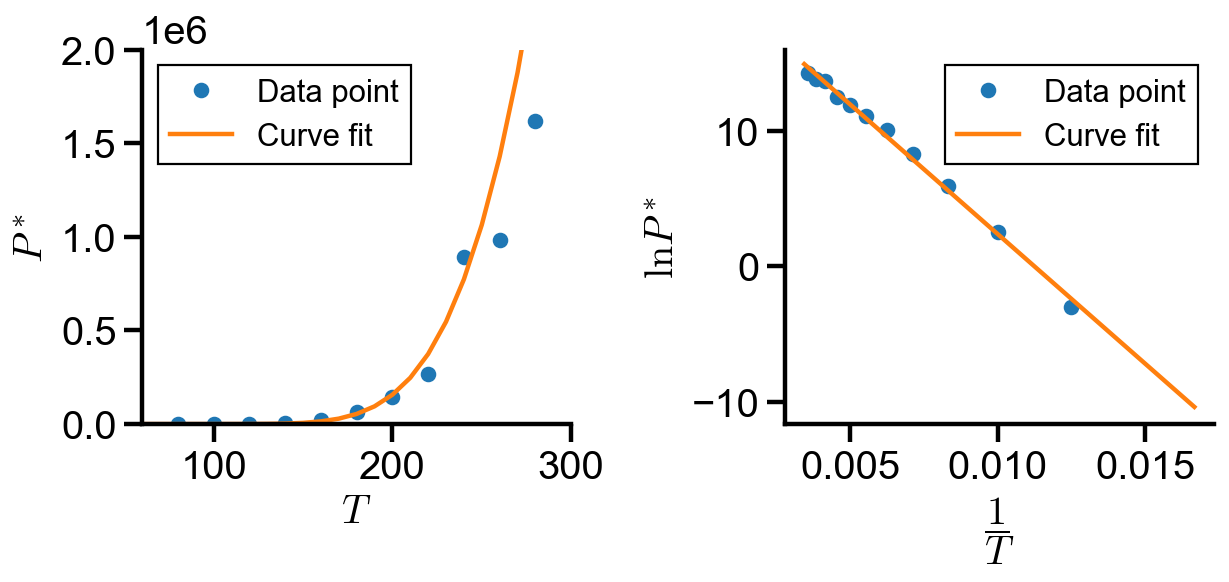
In this approach, we use scipy.optimize.curve_fit() to fit the linearized form.
def clausius_clapeyron_linear(x, A, B):
    '''Linear form of the Clausius-Clapeyron equation'''
    return A*x + B
# use scipy.optimize.curvefit()
popt, pcov = curve_fit(clausius_clapeyron_linear, 1/T, np.log(Pv))
popt
array([-1915.93999621, 21.54152215])
# define curve fit line
inv_T_fit = 1/np.arange(60, 300, 10)
ln_Pv_fit = clausius_clapeyron_linear(1/T_fit, *popt)
fig, axs = plt.subplots(1, 2, figsize=(8, 4))
axs[0].plot(T, Pv, 'o', label='Data point')
axs[0].plot(1/inv_T_fit, np.exp(ln_Pv_fit), label='Curve fit')
axs[0].set_xlabel('$T$')
axs[0].set_ylabel('$P^*$')
axs[0].set_xlim(60, 300)
axs[0].set_ylim(0, 2e6)
axs[0].ticklabel_format(axis="y", style="sci", scilimits=(0, 0))
axs[0].legend()

axs[1].plot(1/T, np.log(Pv), 'o', label='Data point')
axs[1].plot(inv_T_fit, ln_Pv_fit, label='Curve fit')
axs[1].set_xlabel('$\dfrac{1}{T}$')
axs[1].set_ylabel('$\ln P^*$')
axs[1].set_ylim(top=16)
axs[1].legend()

plt.tight_layout(True)

Implementation: Curve fitting using scipy.optimize.minimize()#
The residual (error) between the
so the sum of squared residual (SSR) is
The best fit line of the data points will have a minimum SSR.
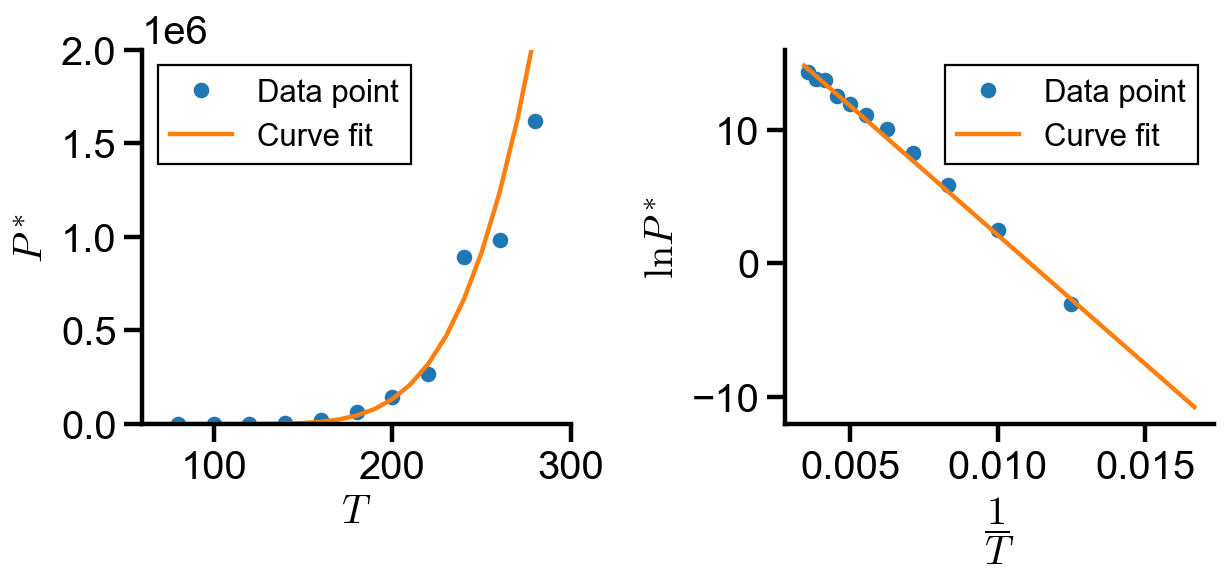
In this approach, we use scipy.optimize.minimize() to minimize the sum of squared residual of the exponential form.
def clausius_clapeyron_SSR(params):
    '''Sum of squared residal of the Clausius-Clapeyron equation'''
    A, B = params
    return np.sum(((Pv - clausius_clapeyron(T, A, B))/(0.1*Pv))**2)
# define initial guess
A_guess = -1000
B_guess = 10
guess = [A_guess, B_guess]
# use scipy.optimize.minimize()
res = minimize(clausius_clapeyron_SSR, guess)
res.x
array([-1931.98479473, 21.45976783])
# define curve fit line
T_fit = np.arange(60, 300, 10)
Pv_fit = clausius_clapeyron(T_fit, *res.x)
fig, axs = plt.subplots(1, 2, figsize=(8, 4))
axs[0].plot(T, Pv, 'o', label='Data point')
axs[0].plot(T_fit, Pv_fit, label='Curve fit')
axs[0].set_xlabel('$T$')
axs[0].set_ylabel('$P^*$')
axs[0].set_xlim(60, 300)
axs[0].set_ylim(0, 2e6)
axs[0].ticklabel_format(axis="y", style="sci", scilimits=(0, 0))
axs[0].legend()

axs[1].plot(1/T, np.log(Pv), 'o', label='Data point')
axs[1].plot(1/T_fit, np.log(Pv_fit), label='Curve fit')
axs[1].set_xlabel('$\dfrac{1}{T}$')
axs[1].set_ylabel('$\ln P^*$')
axs[1].set_ylim(top=16)
axs[1].legend()

plt.tight_layout(True)

Conclusion#
In this notebook, we explored implementation of curve fitting using curve_fit() and minimize(). The coefficients found in each implementation is summarized below:
No. |
Method |
||
|---|---|---|---|
1 |
|
-1477 |
19.57 |
2 |
|
-1916 |
21.54 |
3 |
|
-1932 |
21.46 |
By inspection of the graphs and the coefficient table, we found that method 2 and 3 most accurately fits the over data trend, whereas method 1 fails to capture the trend at small

